Integrated Annual Report 2012

Home > Reviews and reports > Five-Year Summary
Reviews and reports
Five-Year Summary
| 2008 | 2009 | 2010 | 2011 | 2012 | |
|---|---|---|---|---|---|
| Income statements | R’000 | R’000 | R’000 | R’000 | R’000 |
| Turnover | 9 158 937 | 8 818 655 | 7 085 669 | 10 547 806 | 12 947 766 |
| Profit before profit on disposal of |
4 665 106 | 5 229 794 | 2 334 460 | 4 816 210 | 5 112 526 |
| Profit on disposal of |
22 350 | 19 086 | – | – | 472 200 |
| Taxation | (1 509 091) | (1 981 493) | (822 963) | (1 566 524) | (1 537 692) |
| Profit for the year | 3 178 365 | 3 267 387 | 1 511 497 | 3 249 686 | 4 047 034 |
| Attributable to: | |||||
| – Shareholders of the holding company | 3 069 522 | 3 241 452 | 1 479 524 | 3 219 754 | 4 033 013 |
| – |
108 843 | 25 935 | 31 973 | 29 932 | 14 021 |
| As above | 3 178 365 | 3 267 387 | 1 511 497 | 3 249 686 | 4 047 034 |
| Other information | |||||
| Attributable earnings as above | 3 069 522 | 3 241 452 | 1 479 524 | 3 219 755 | 4 033 013 |
| Headline earnings (R’000) | 3 057 708 | 3 265 793 | 1 494 205 | 3 219 348 | 3 707 763 |
| Attributable earnings per share (cents) | 2 281 | 2 734 | 1 236 | 2 691 | 3 827 |
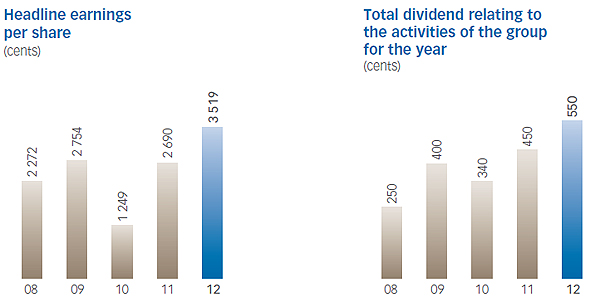
| Headline earnings per share (cents) | 2 272 | 2 754 | 1 249 | 2 690 | 3 519 |
| Dividends declared during the year | 126 000 | 555 717 | 415 324 | 614 271 | 698 036 |
| Less: Dividends attributable to treasury shares | (4 392) | (76 311) | (56 309) | (87 716) | (182 000) |
| 121 608 | 479 406 | 359 015 | 526 555 | 516 036 | |
| Dividends per share relating to the activities of the group for the year under review (cents) | |||||
| – Interim declared and paid | 50 | 200 | 100 | 200 | 250 |
| – Final (declared subsequent to |
200 | 200 | 240 | 250 | 300 |
| 250 | 400 | 340 | 450 | 550 | |
| Weighted average number of shares for purposesof calculating earnings per share (000): | |||||
| Ordinary shares in issue | 140 000 | 138 290 | 138 430 | 139 601 | 139 607 |
| Treasury shares | (5 440) | (19 720) | (18 750) | (19 936) | (34 240) |
| Weighted average | 134 560 | 118 570 | 119 680 | 119 671 | 105 367 |
| Average exchange rates for the year: | |||||
| SA rand to US dollar | 7,27 | 8,80 | 7,60 | 7,00 | 7,73 |
| SA rand to euro | 10,72 | 12,08 | 10,53 | 9,54 | 10,39 |
 |
|||||
| 2008 | 2009 | 2010 | 2011 | 2012 | |
| Statements of financial position | R’000 | R’000 | R’000 | R’000 | R’000 |
| ASSETS | |||||
| Property, plant and equipment, investment properties and intangibles | 4 196 018 | 5 183 450 | 6 409 471 | 8 027 352 | 9 529 499 |
| 590 066 | 415 066 | 602 851 | 918 038 | 274 058 | |
| Other |
125 | 42 259 | 105 173 | 53 051 | 106 665 |
| Deferred taxation | 61 977 | 74 309 | 71 572 | – | – |
| 4 848 186 | 5 715 084 | 7 189 061 | 8 998 441 | 9 910 222 | |
| Current assets | |||||
| Other current assets | 3 286 272 | 2 397 097 | 3 253 023 | 3 637 847 | 4 226 848 |
| Cash resources | 1 988 957 | 3 049 067 | 1 907 909 | 2 334 734 | 3 324 437 |
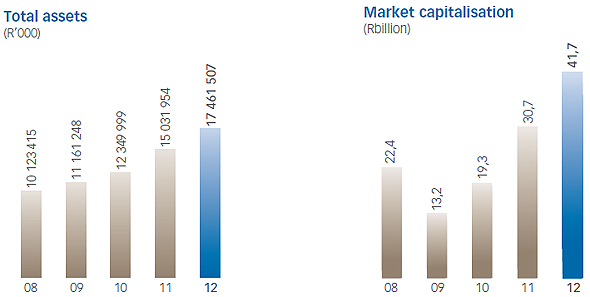
| Total assets | 10 123 415 | 11 161 248 | 12 349 999 | 14 971 022 | 17 461 507 |
| EQUITY AND LIABILITIES | |||||
| Share capital and reserves | |||||
| Ordinary shareholders' interest | 4 110 872 | 6 603 229 | 7 867 443 | 10 765 524 | 11 200 402 |
| 111 528 | 71 819 | 102 035 | 114 287 | 126 858 | |
| Total equity | 4 222 400 | 6 675 048 | 7 969 478 | 10 879 811 | 11 327 260 |
| Deferred taxation | 961 678 | 1 416 145 | 1 785 301 | 2 173 621 | 2 357 001 |
| 223 320 | 257 513 | 216 826 | 222 888 | 1 938 844 | |
| 5 407 398 | 8 348 706 | 9 971 605 | 13 276 320 | 15 623 105 | |
| Current liabilities | |||||
| 2 094 528 | 1 188 699 | 1 346 749 | 1 540 555 | 1 646 383 | |
| 2 621 489 | 1 623 843 | 1 031 645 | 154 147 | 192 019 | |
| Total equity and liabilities | 10 123 415 | 11 161 248 | 12 349 999 | 14 971 022 | 17 461 507 |
| Exchange rates at |
|||||
| SA rand to US dollar | 7,84 | 7,72 | 7,66 | 6,78 | 8,31 |
| SA rand to euro | 12,37 | 10,79 | 9,39 | 9,82 | 10,45 |
 |
|||||
sdfsdfsdf